Find answers in your data. Visually.
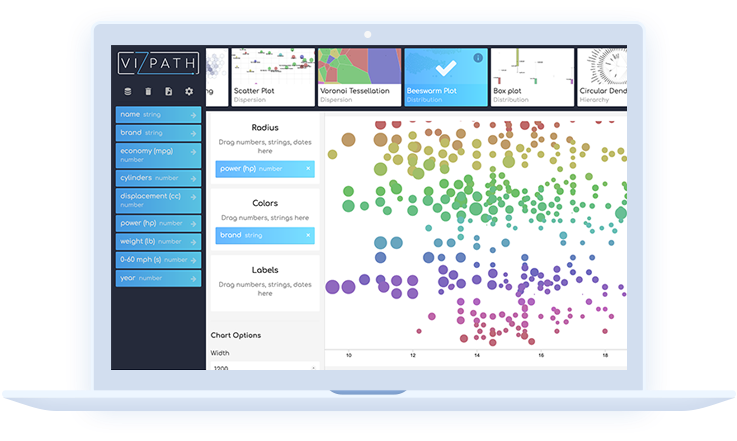
VizPath works with delimiter-separated values (like .csv and .xlsx files) as well as copied-pasted content from other applications (like Microsoft Excel, Google Spreadsheets, etc).
Although VizPath is a web applicaton, the data you load will only be processed by the web browser. No server-side operations or storages are performed, so no one will see, touch or copy your data!
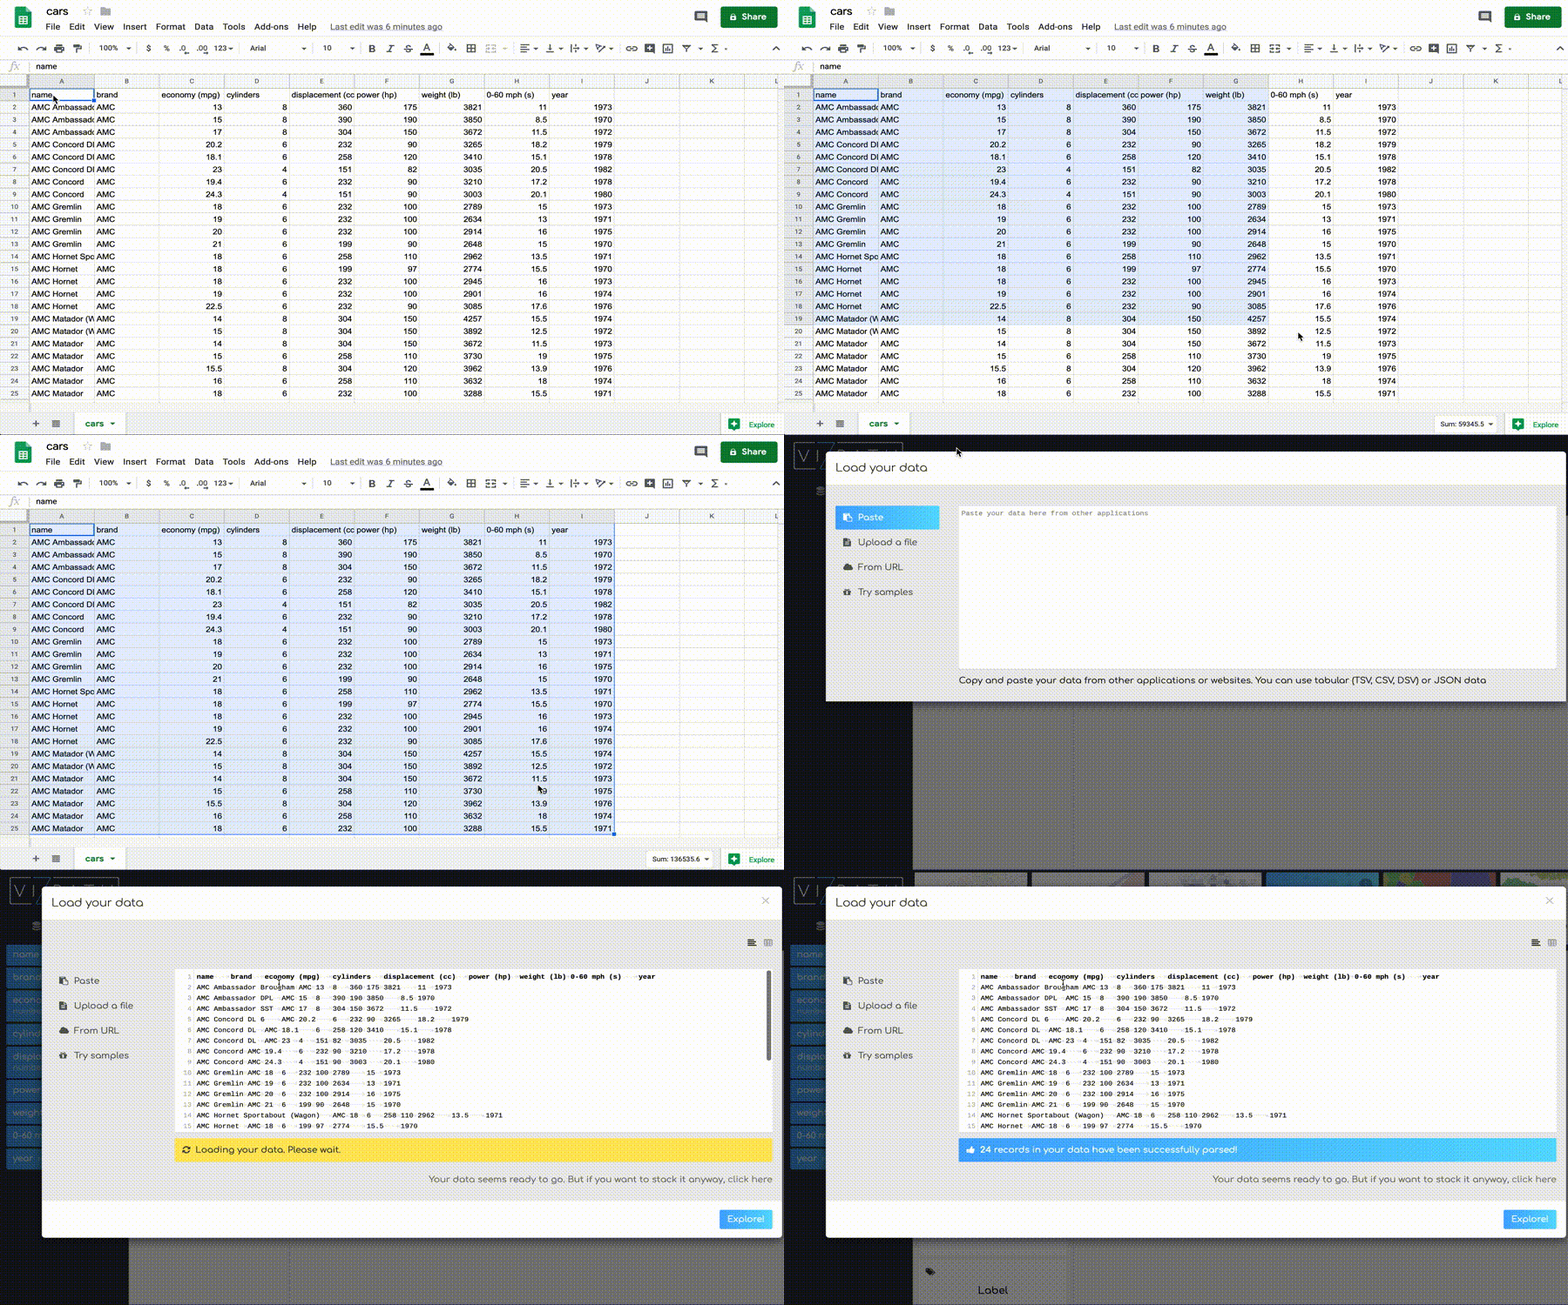
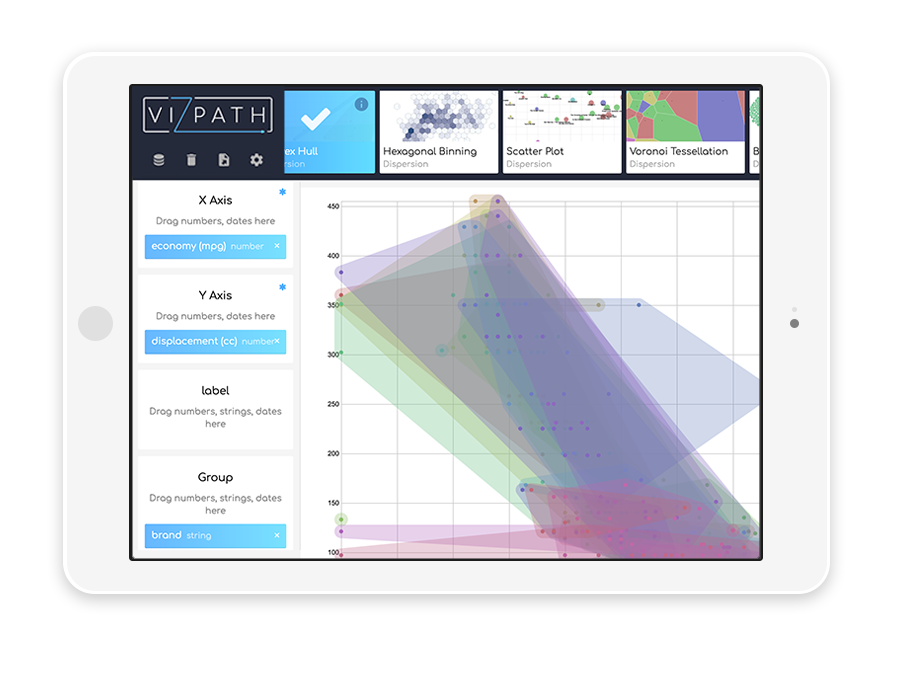
Select from a variety of both conventional and unconventional data visualizations including scatter plots, box plots, dendograms, hexagonal binning charts, and more. Also don’t worry, you can still use bar charts and pies charts too!
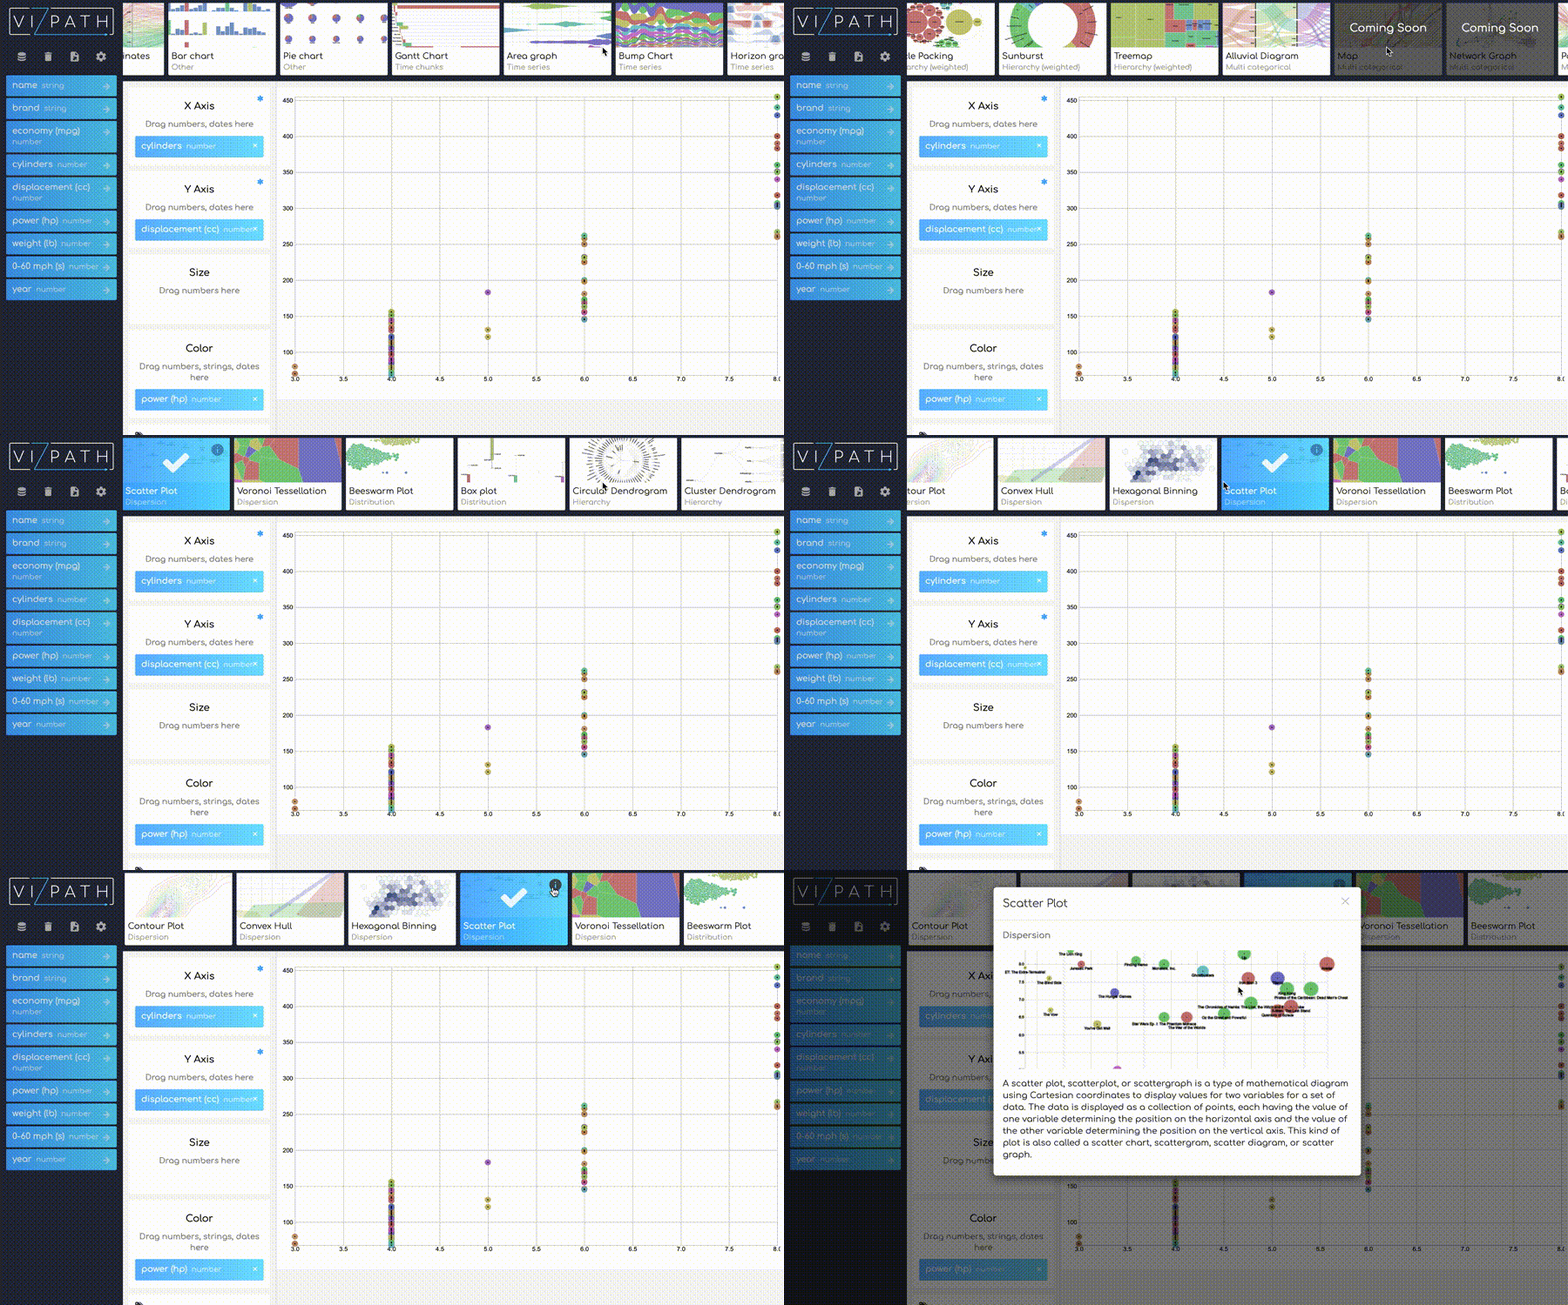
Explore hidden patterns and trends by visually representing your data. Just drag-and-drop the columns in your dataset to discover new ways of looking at your analysis.
As soon as your columns are mapped, you’ll see the visualization appear. Not happy with the result? Keep exploring by changing your selected column mappings and the visualization will update instantly.
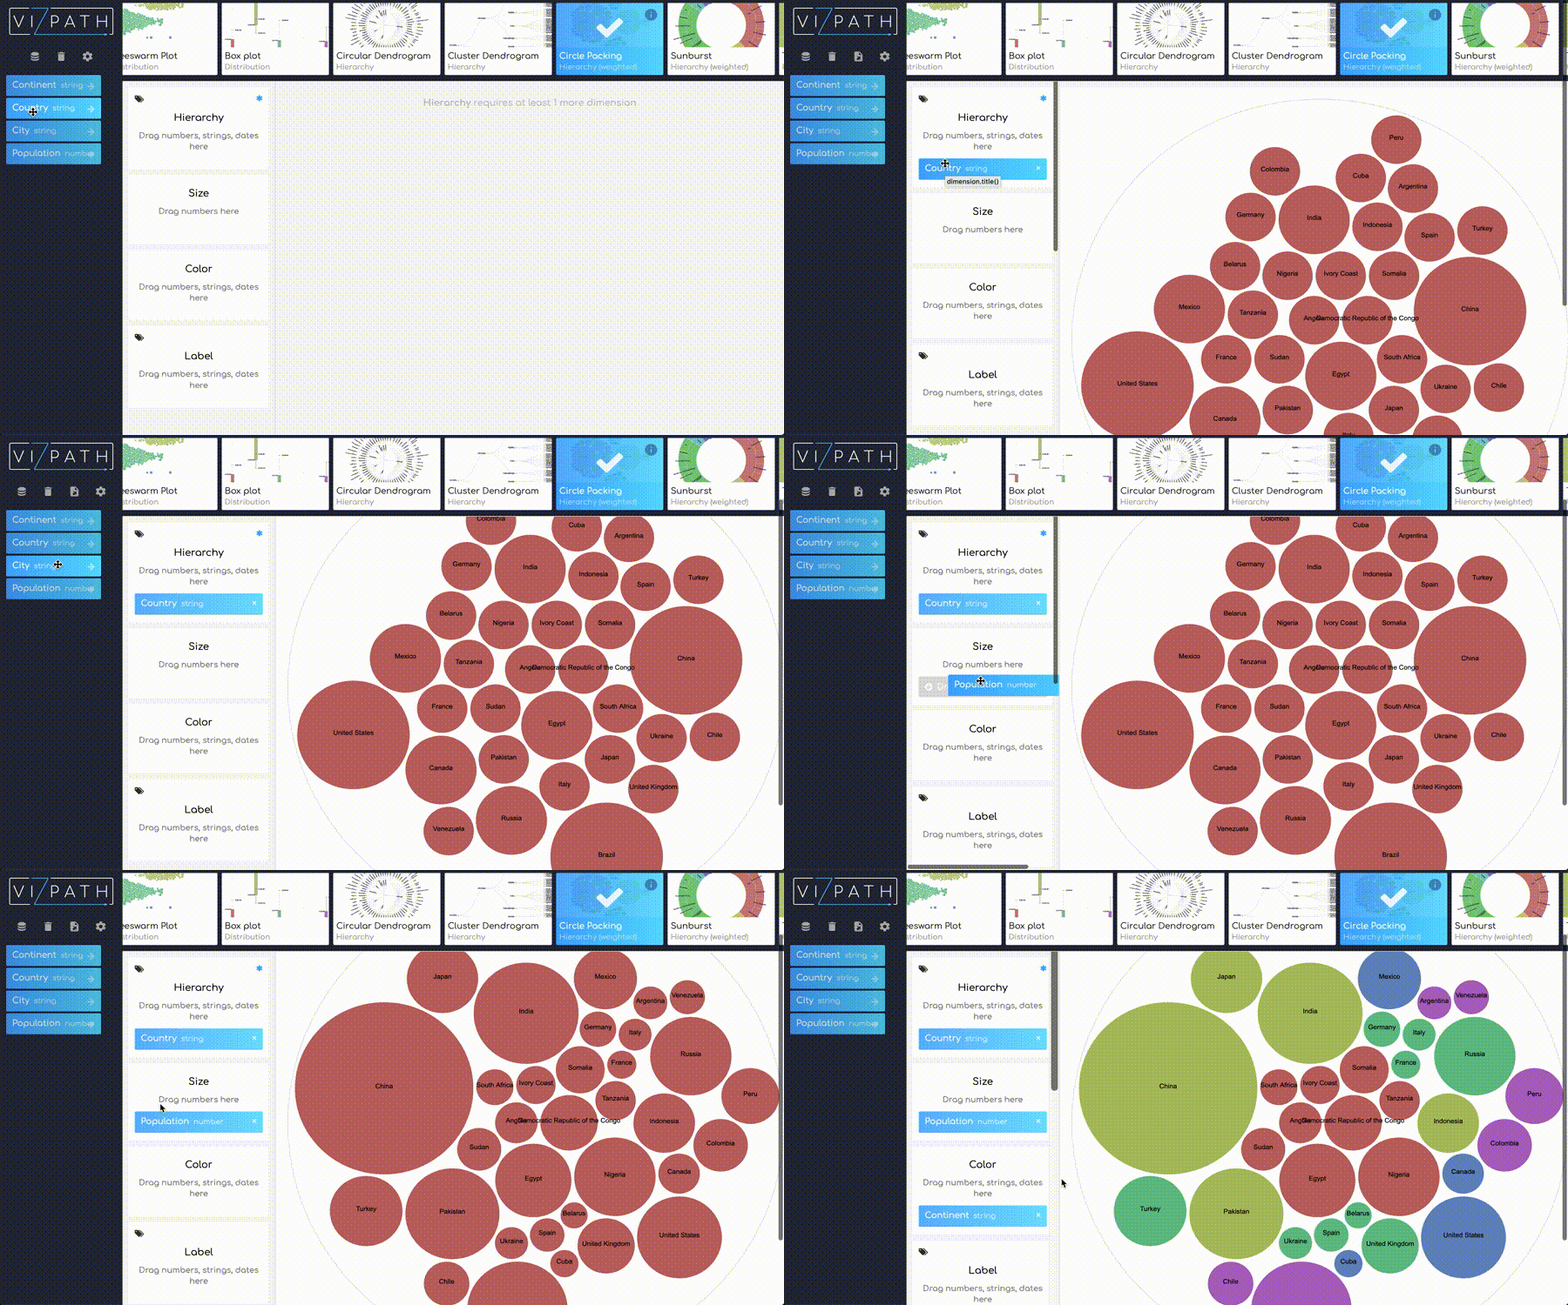
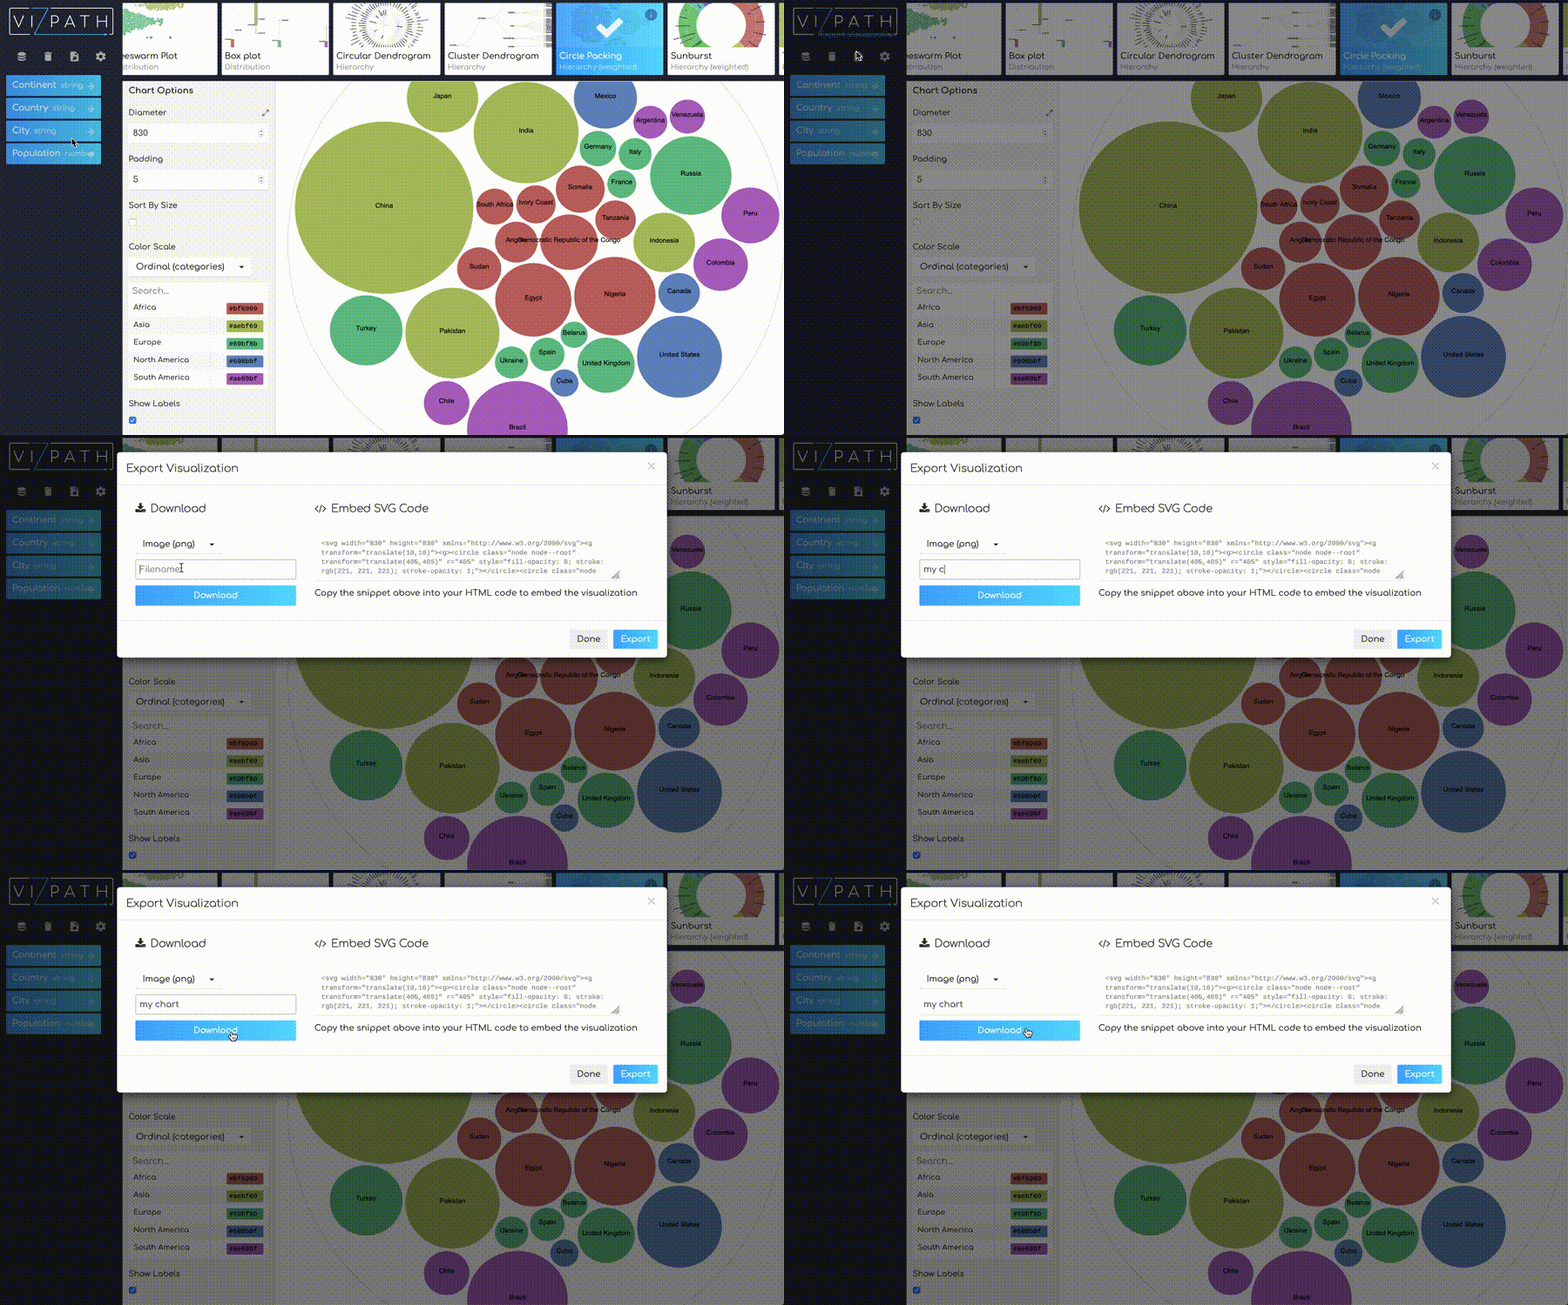
VizPath enables you to customize and export visualizations as vector (.svg) or raster (.png) images for use in websites, documents, powerpoints...or wherever want to insert your visual.
VizPath is currently in Beta.
Try it free today and see what is hidden in your data.